 Please don’t compare your data to the screenshots included in this FAQ. The data that is show in your own dashboard could be affected by lots of different things. To understand how to interprete your data, have a look here.
ConnectedHome is our dashboard. It details all the metrics your Whitebox measures and will be your source of knowledge. The dashboard provides the information to monitor your internet performance.
You can find more about the Whitebox here.
To get access to ConnectedHome, you need to signup to be a volunteer. If you want to know how to signup, have a look at this page.
To view your test results your Whitebox needs to be properly connected. If you want to know more about installing your Whitebox, please read this article.
If you cannot log into your account / dashboard, please have a look at this article.
1. The 'Dashboard' page displays several important pieces of information.
- Your Whitebox' Unit ID, installation address, MAC address and the broadband details you have provided (Internet Service Provider and Package).
- Metrics such as speed (Download and Upload), Latency, Packet Loss, Disconnections by default.
- Instant and RealSpeed test results (if available).
- Data used by the Whitebox.
- Skipped tests. You find more information on Cross-traffic here.
Note: Depending on the project you are part of, the board might be slightly different.
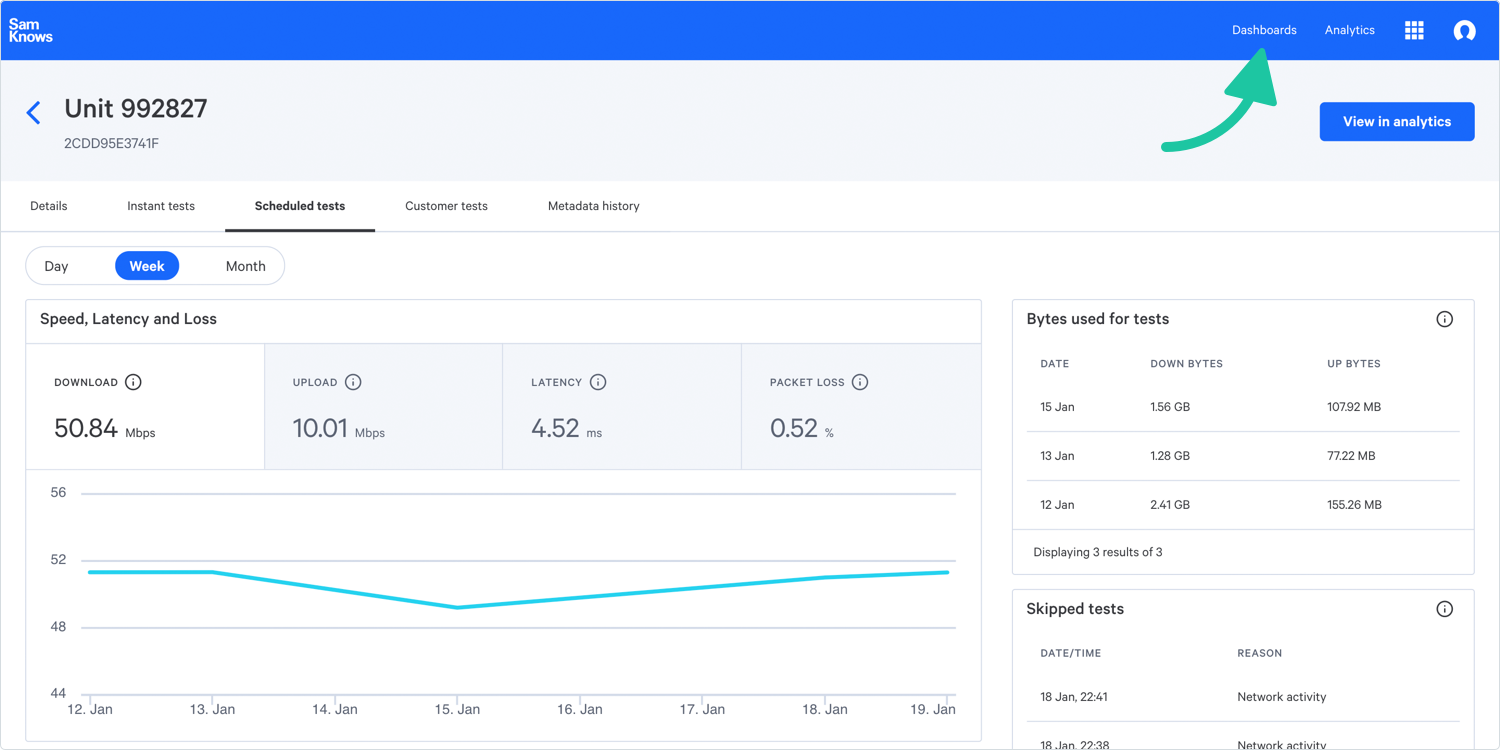
For more information regarding data interpretation, please have a look at the article 'How do I interprete my data?'.
2. The 'Analytics' page gives you a focus on one customisable metric.
By default, you will see 'Download Speed (Multi-Thread Only)', but you can customise the metric, chart type and date range by selecting the desired features in the drop-down menus on the left-side of your screen.
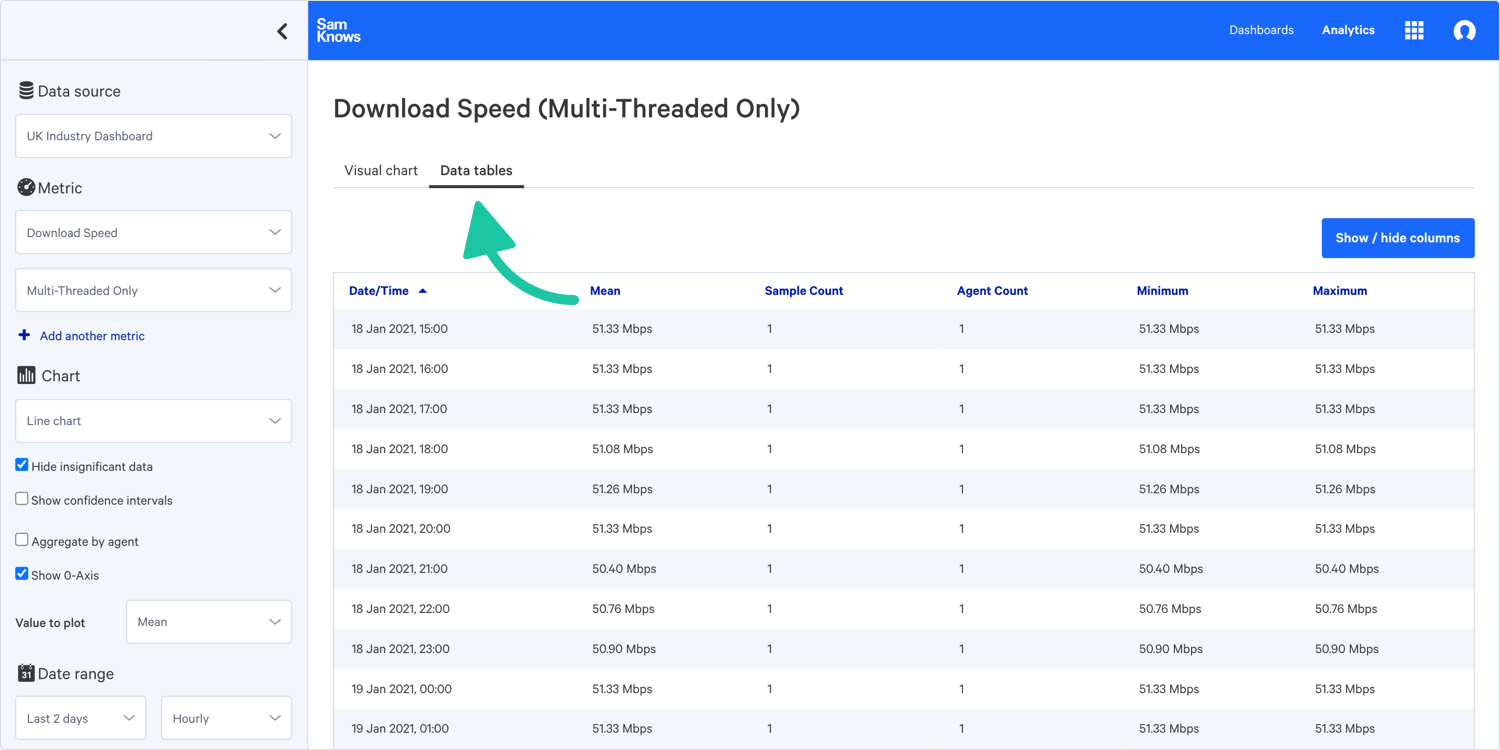
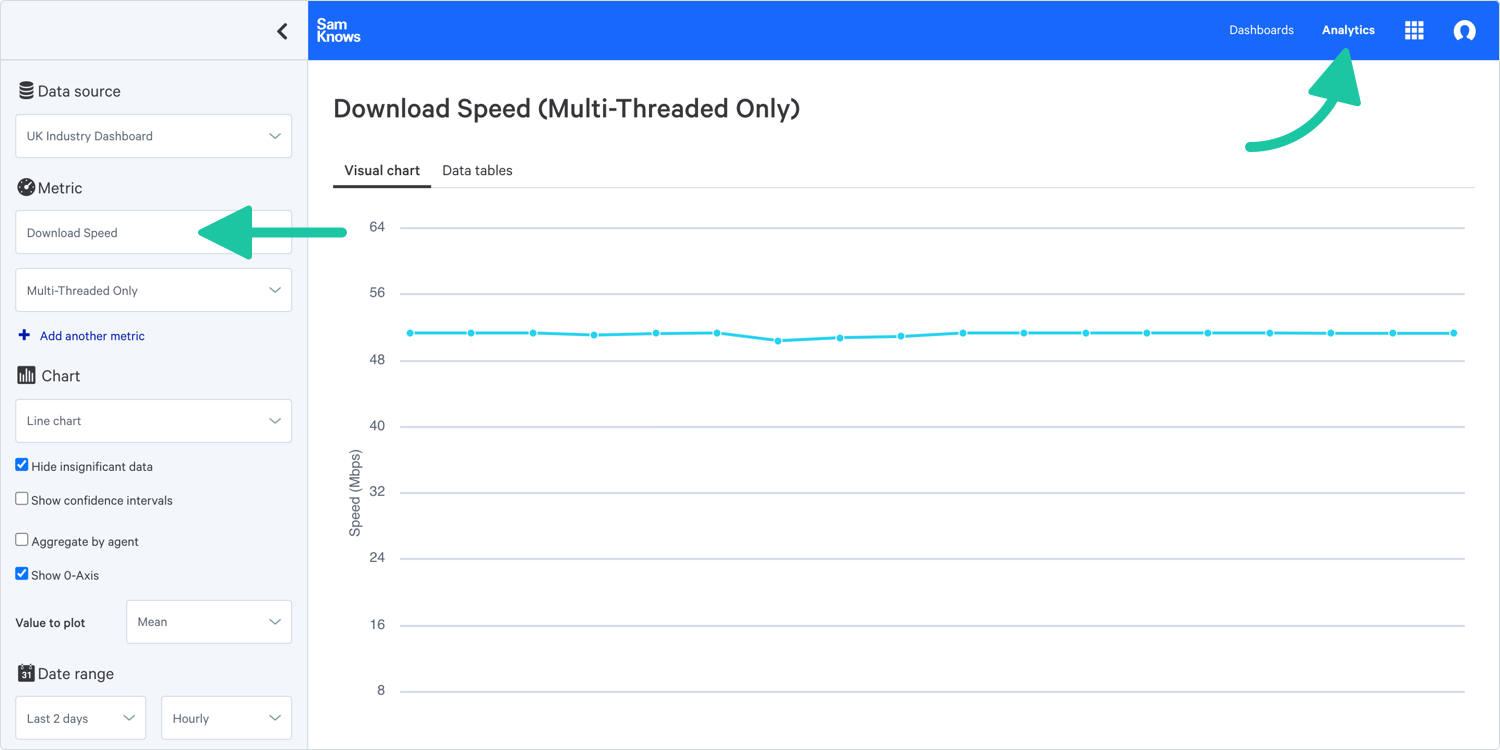 You can also have access to the list of data (vs. visual chart) by selecting the 'Data tables' tab on the top left of your chart.
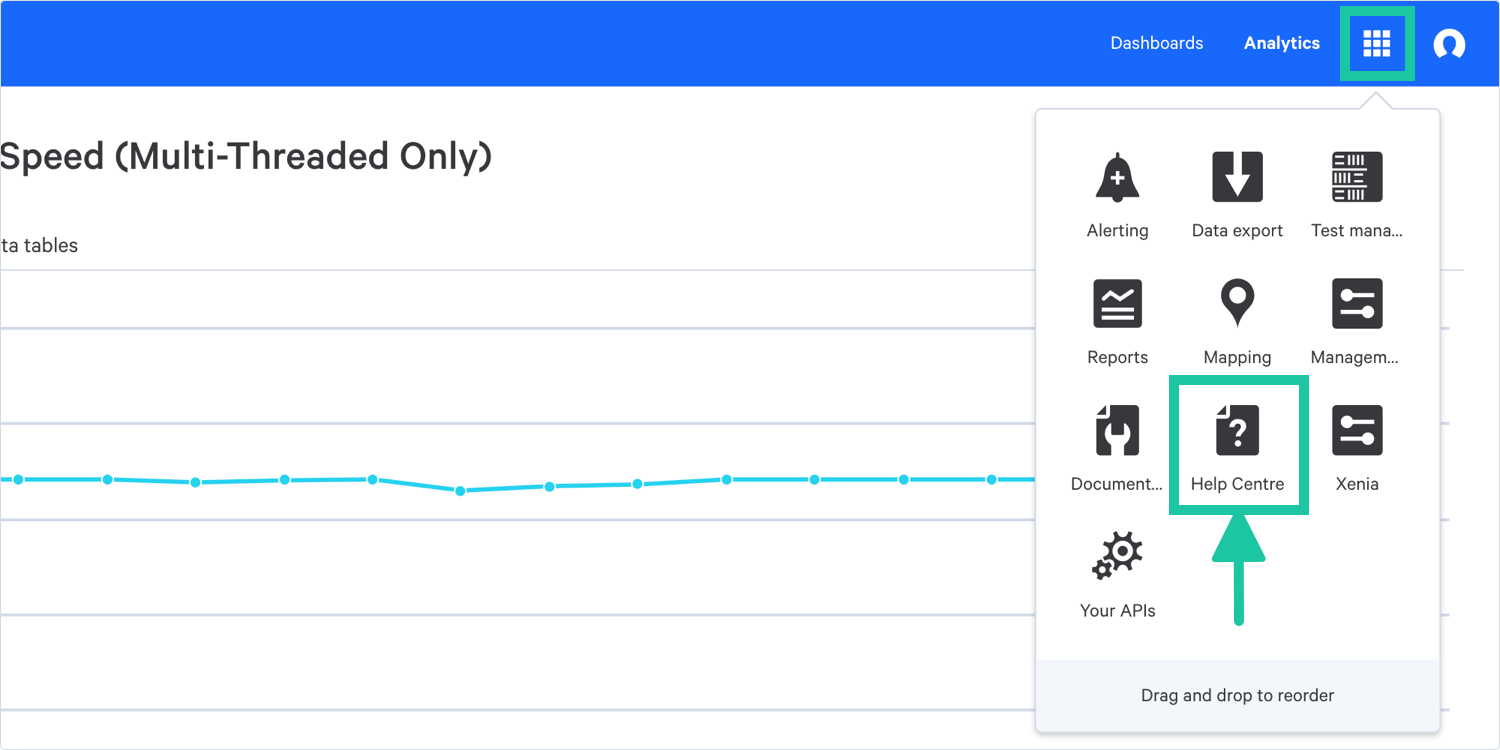
3. Our 'FAQs' are accessible by clicking on the multiple-square tab as below.
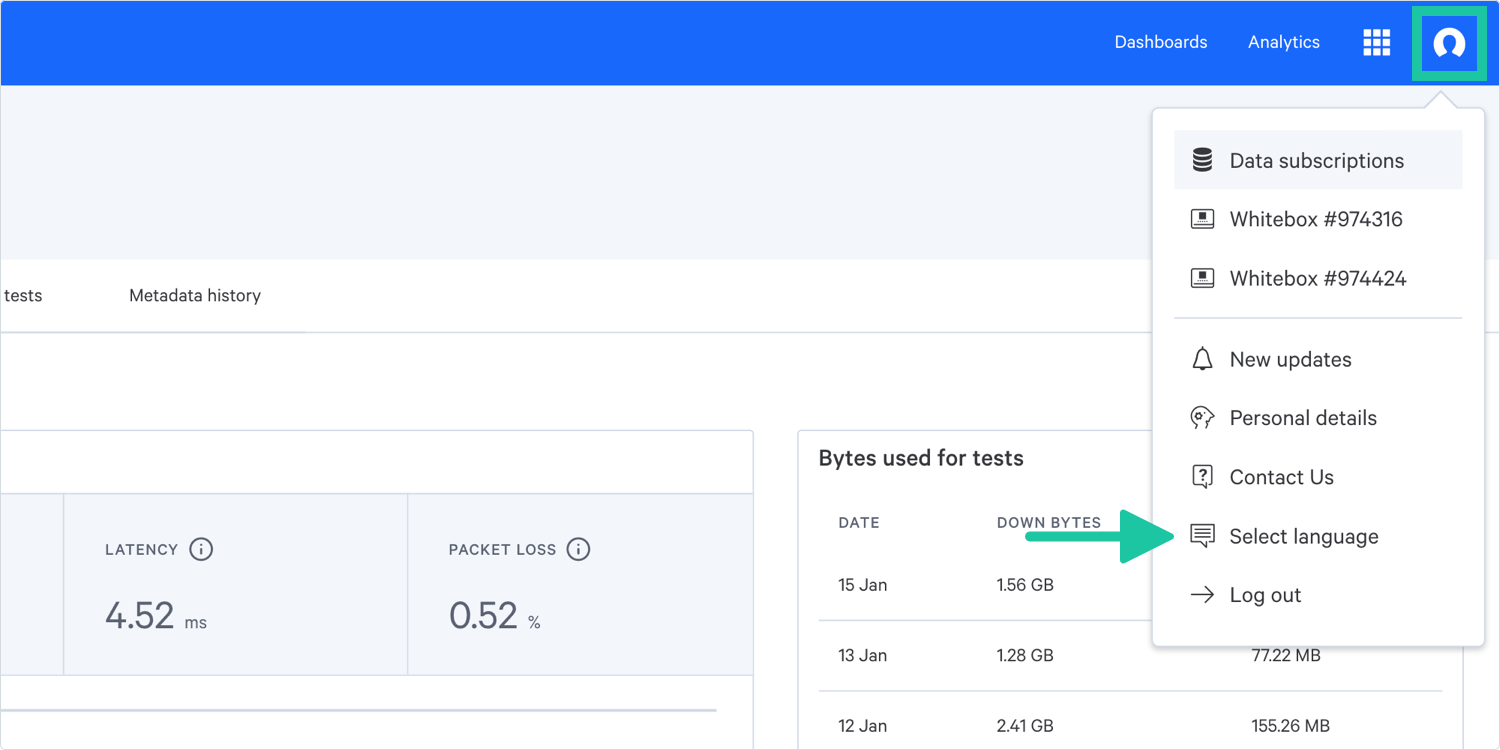
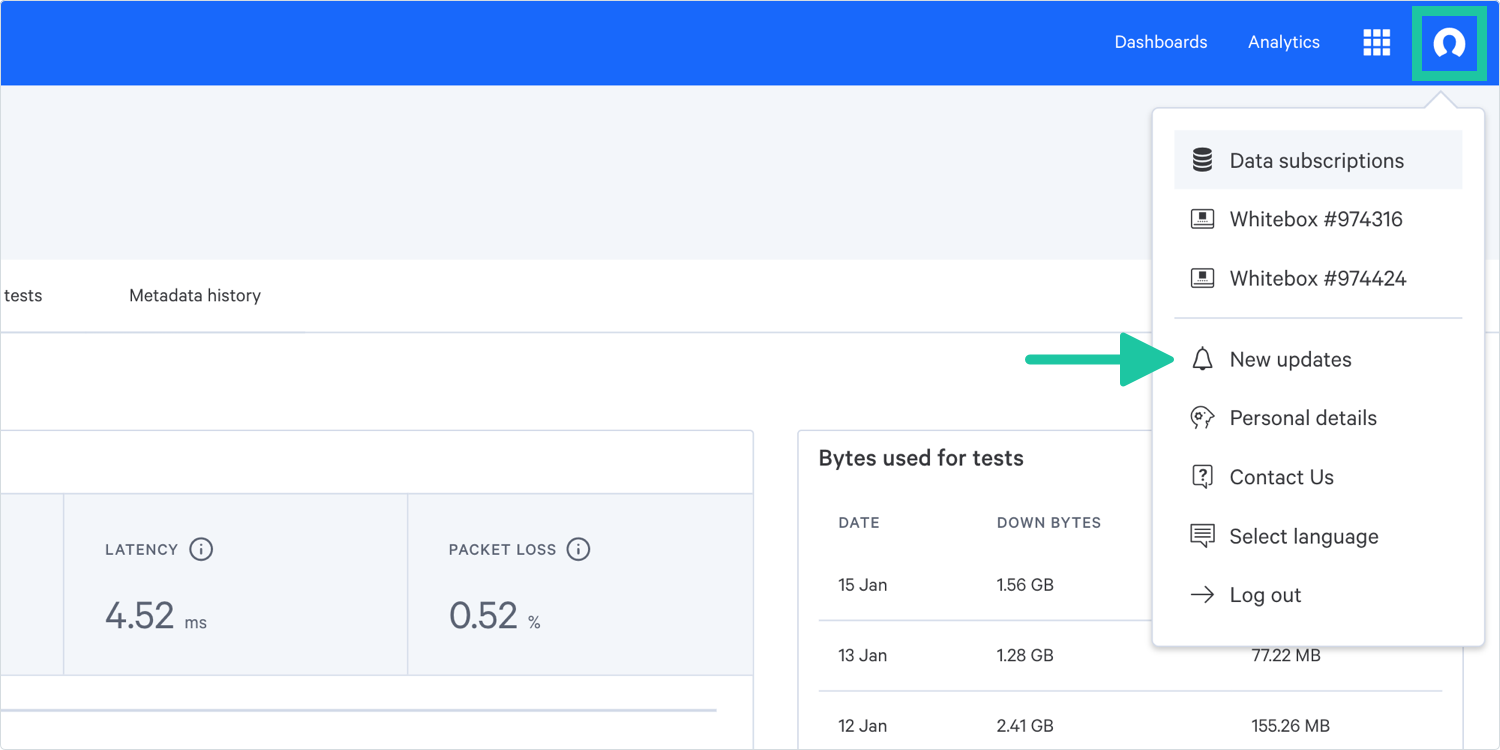
4. The 'Silhouette' icon leads you to:
- New updates - some updates can be obvious when others can be hidden. This section will detail the new features, bug fixes or general improvements.
You can have access to the previous updates by clicking on the 'Load previous updates' as per the picture below.
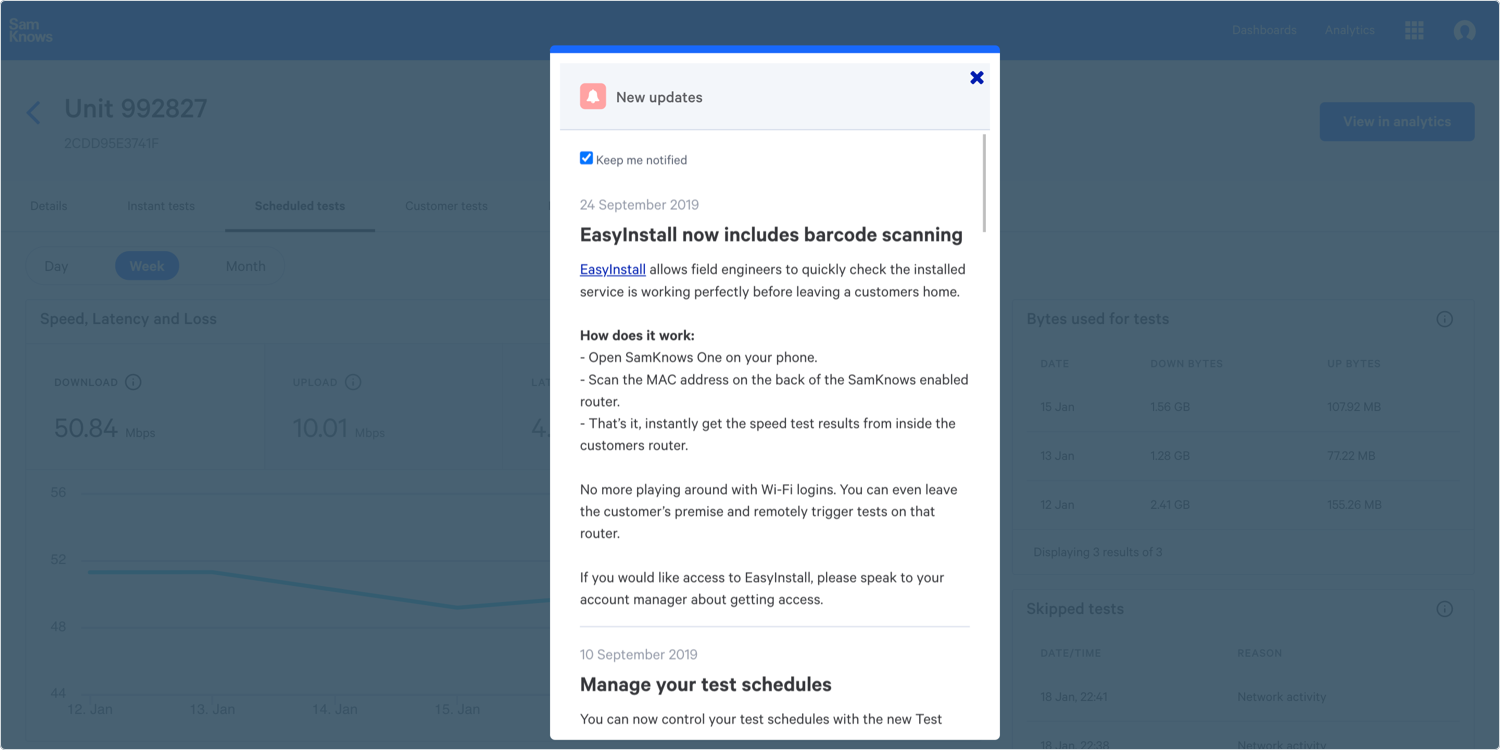
You can be notified by ticking the 'Keep me notified' box or you can just check this section when you feel like it to see what the new updates are.
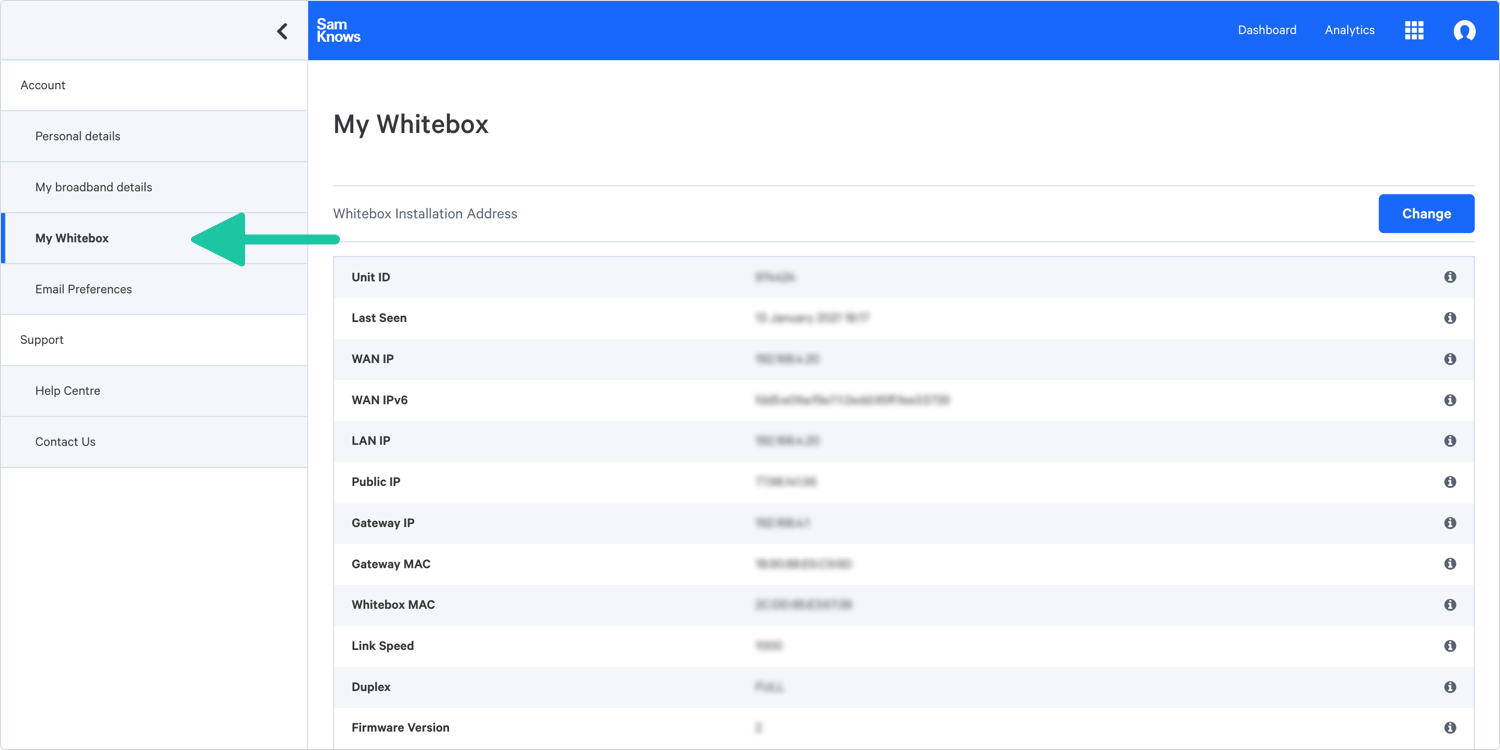
- 'My Whitebox' displays all the details related to your Whitebox. These include details such as Last Seen data, Public IP and MAC address. If you don't understand some of these features, more information can be found by hovering over the 'i'.
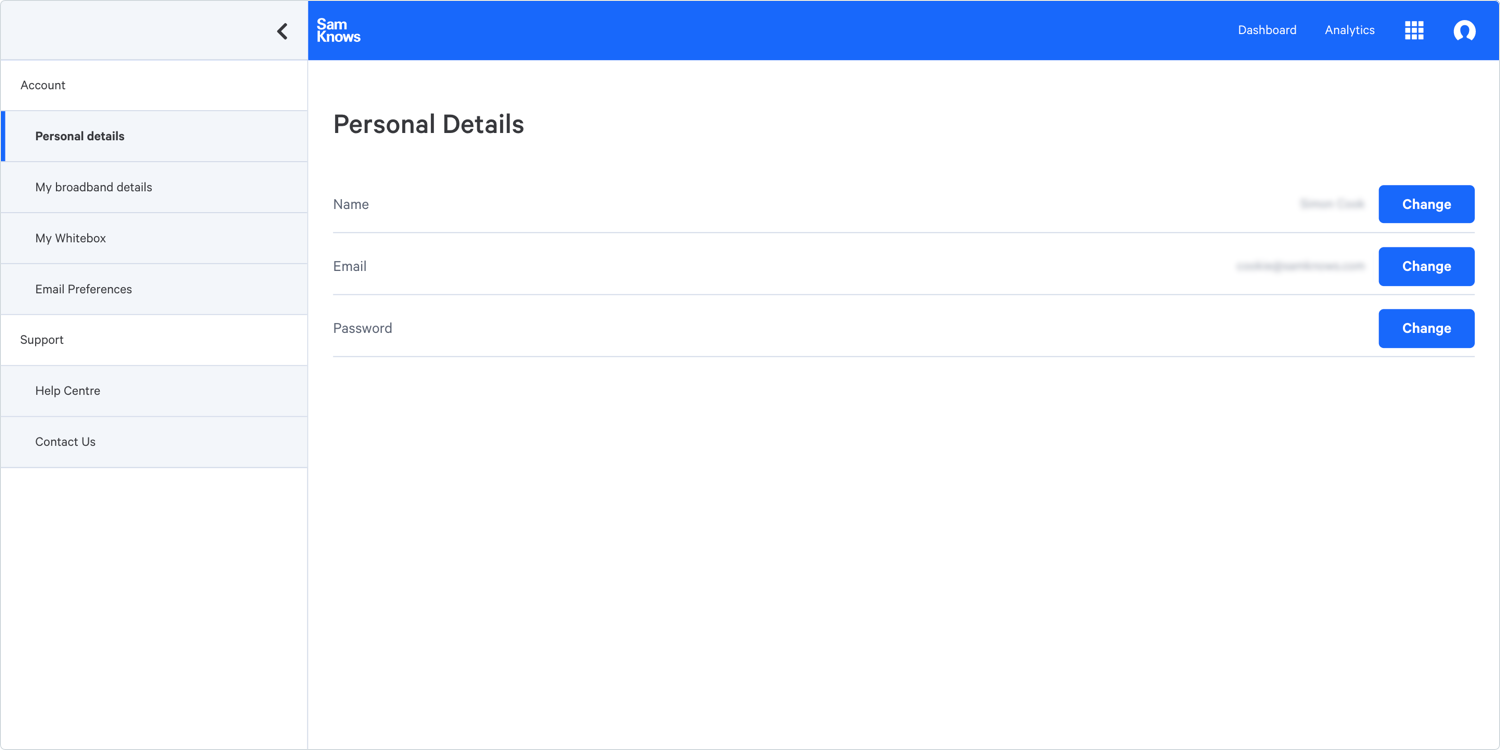
- Your personal details - is where you can update your name, email address and password used to log into ConnectedHome. For more information have a look at this article.
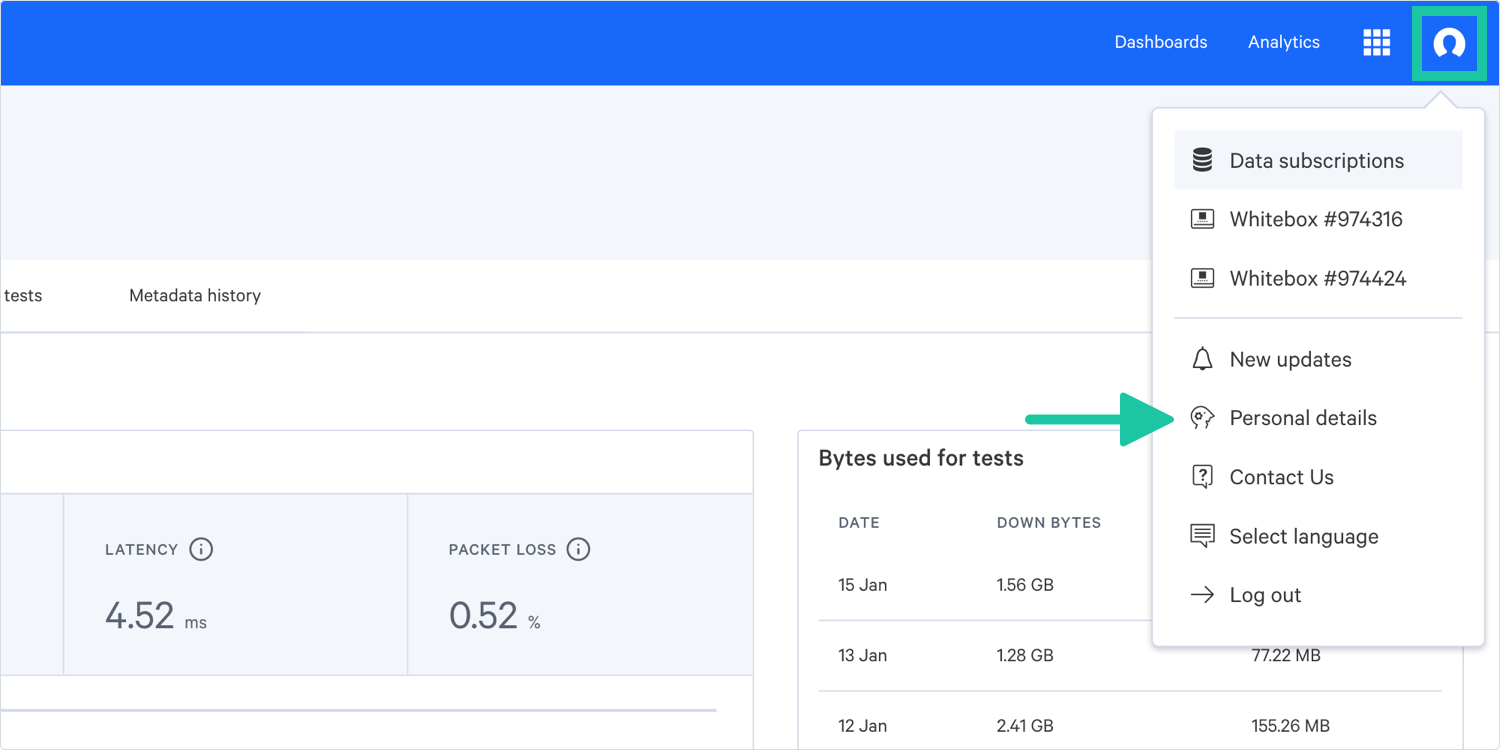
- 'Broadband details' is where you can update your Internet Service Provider (ISP) and Broadband package (speed-tier).
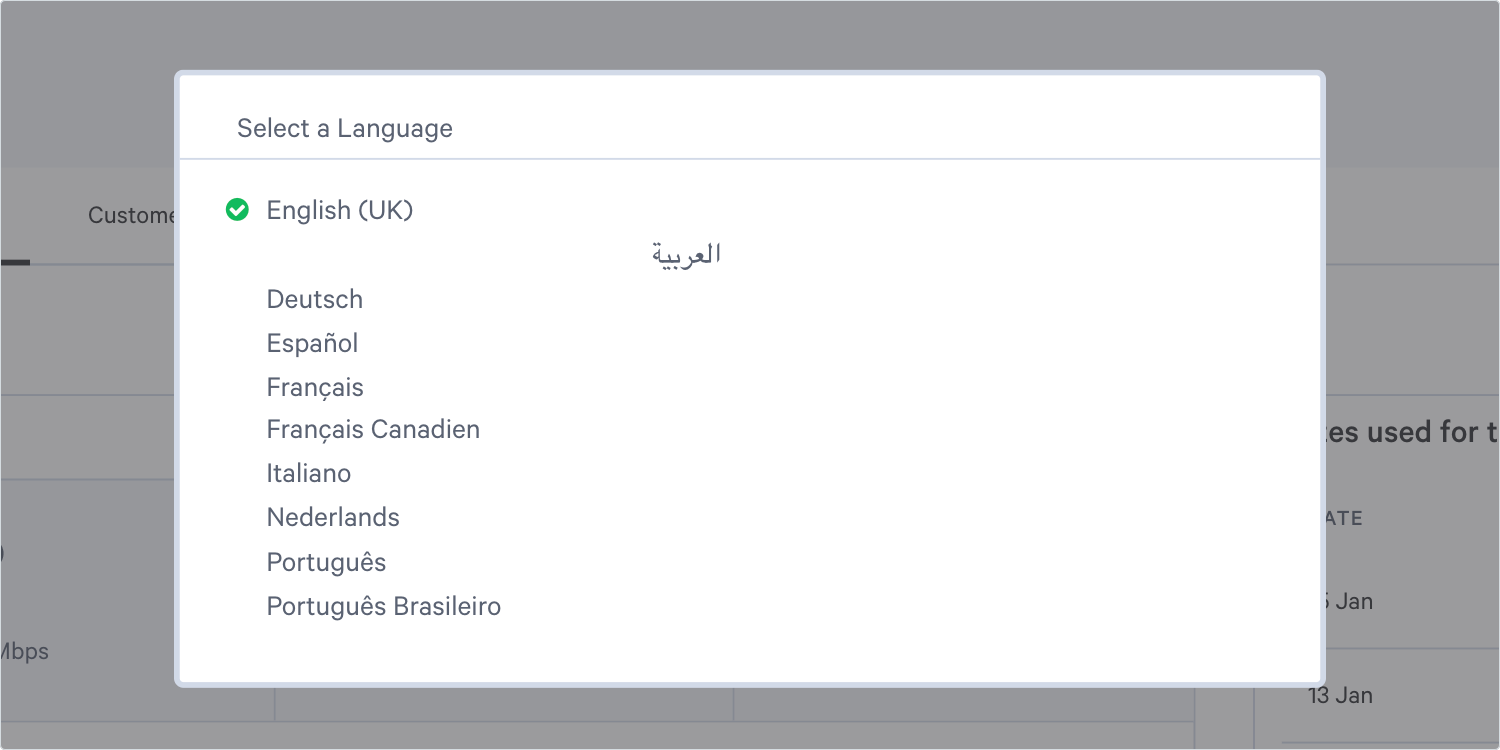
- 'Select Languages' - if you want to have access to your dashboard in another language, click on “Select langagues” and select your desired language: English (UK), Arabic, German, Spanish, French, Canadian French, Italian, Dutch, Portuguese, Brasilian Portuguese.