Multiple Data Series
Governments; ISPs
This guide will show you how to use multiple data series, which lets you generate multiple line charts on the same chart.
Creating a Multiple Data Series Chart
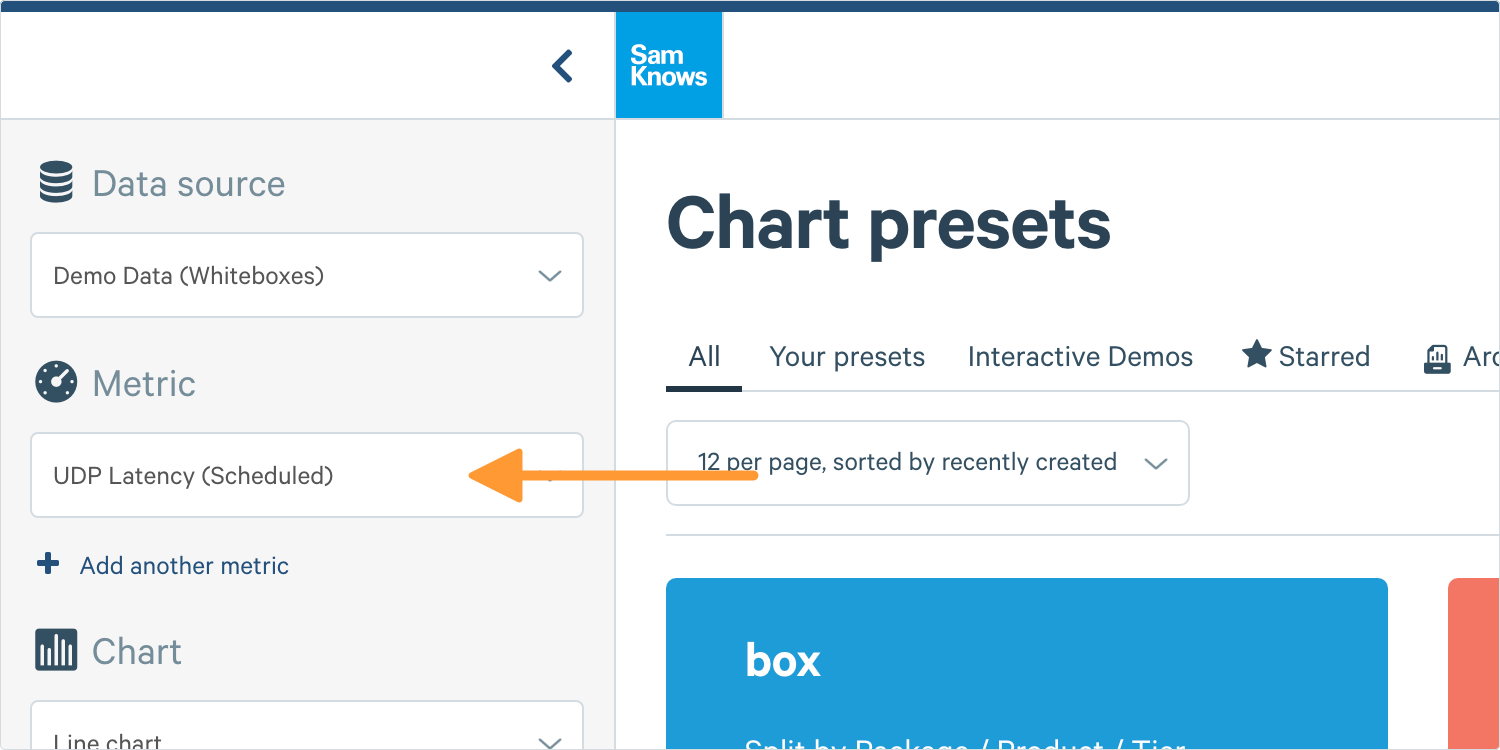
1. First, let's build our first data series using the Chart Builder on the left-hand side of your screen.
2. Select Show Advanced Options under Analytics in the Chart Builder.
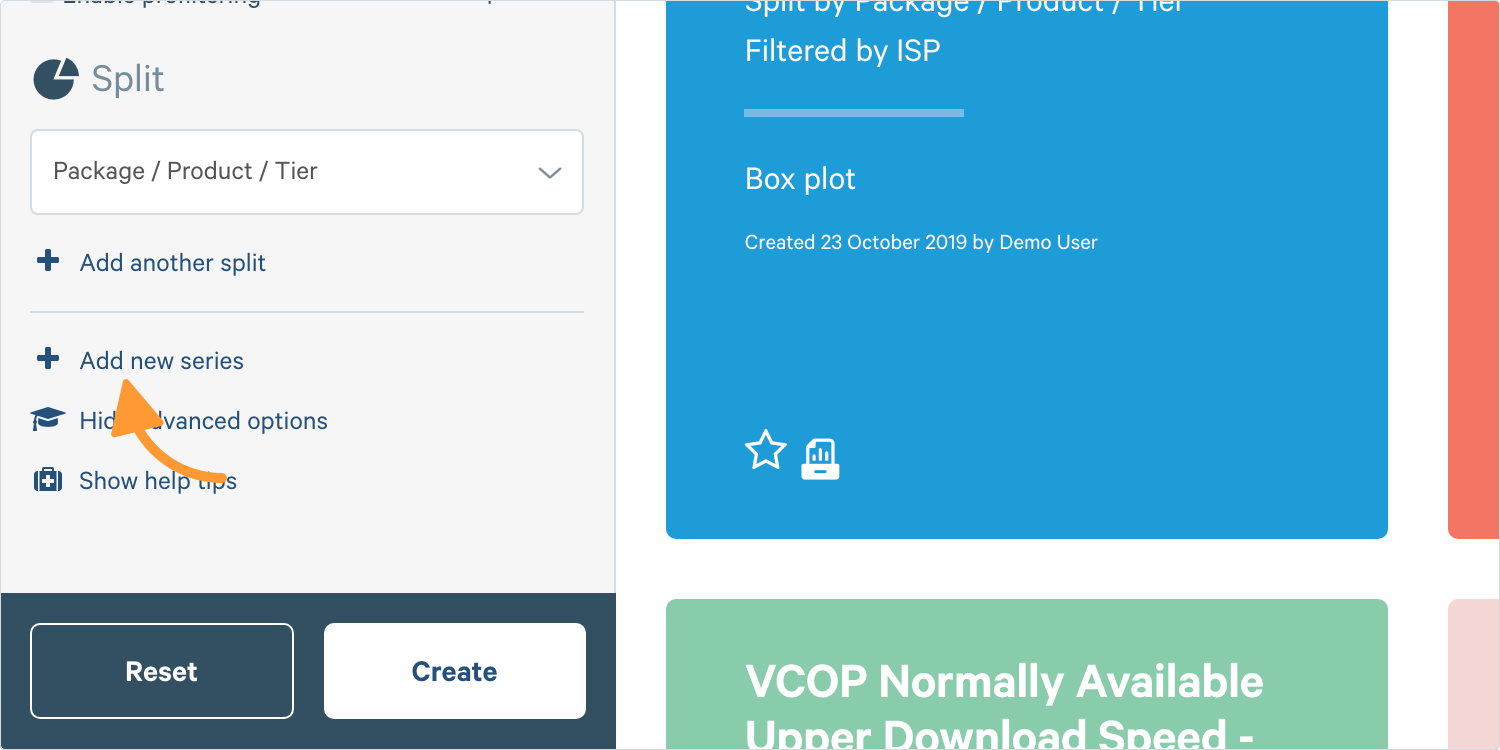
3. You will now see a new option at the bottom of the chart builder that says Add Another Series, select this.
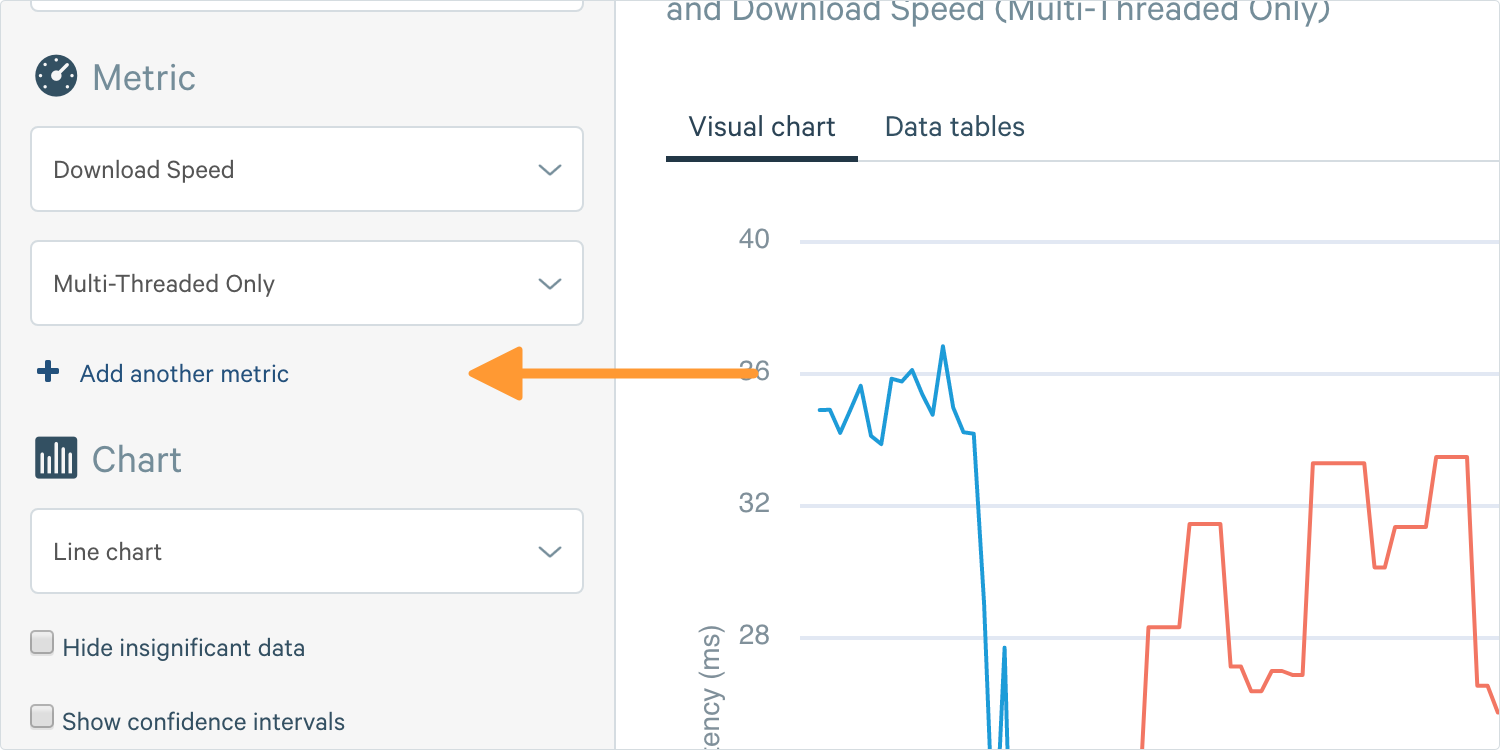
Tip: If you want to use the same splits and filters as before but with additional metrics with the same unit (e.g. both measured in ms), you can use the shortcut ‘Add a new metric button’ instead.
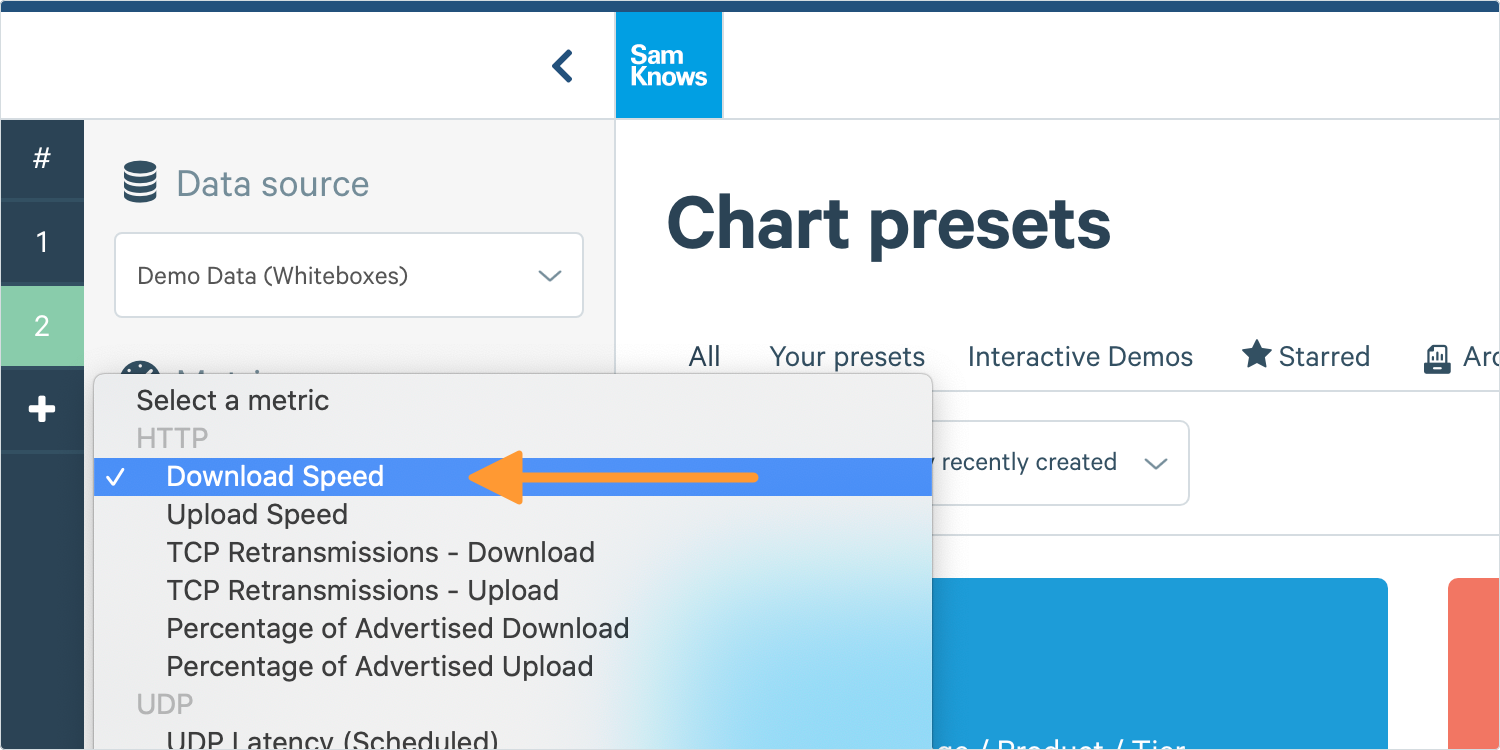
4. Your chart builder will now display the numbers on the left. Each number represents a separate data series.
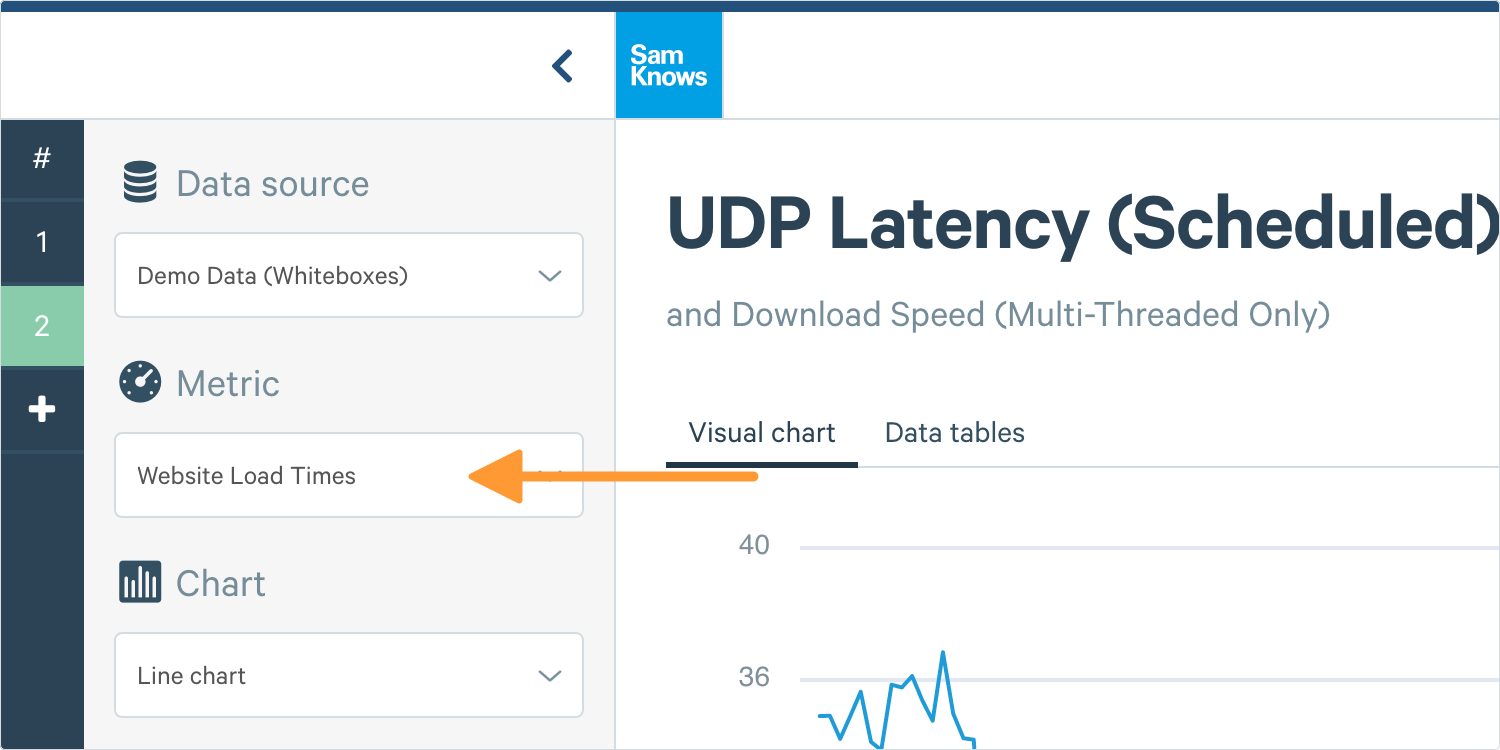
If you click on 1, you will see the first data series you created. If you click on 2, you will be shown a fresh chart builder where you can Build Your Second Data Series. Let's build our second data series for website load times; and then click Create to create the chart.
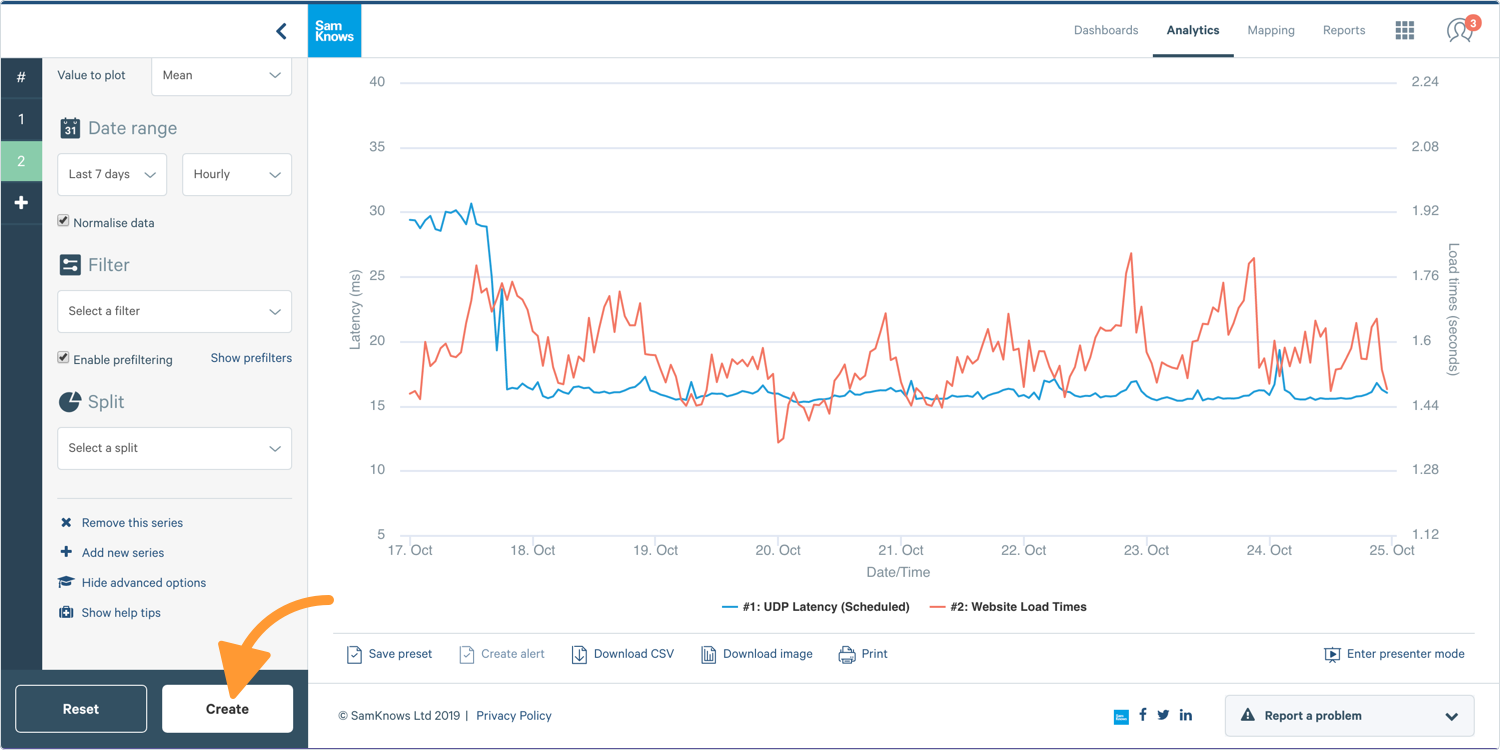
The line chart above shows multiple data series, and we can see a correlation between high latency and slow load times on 15th November.
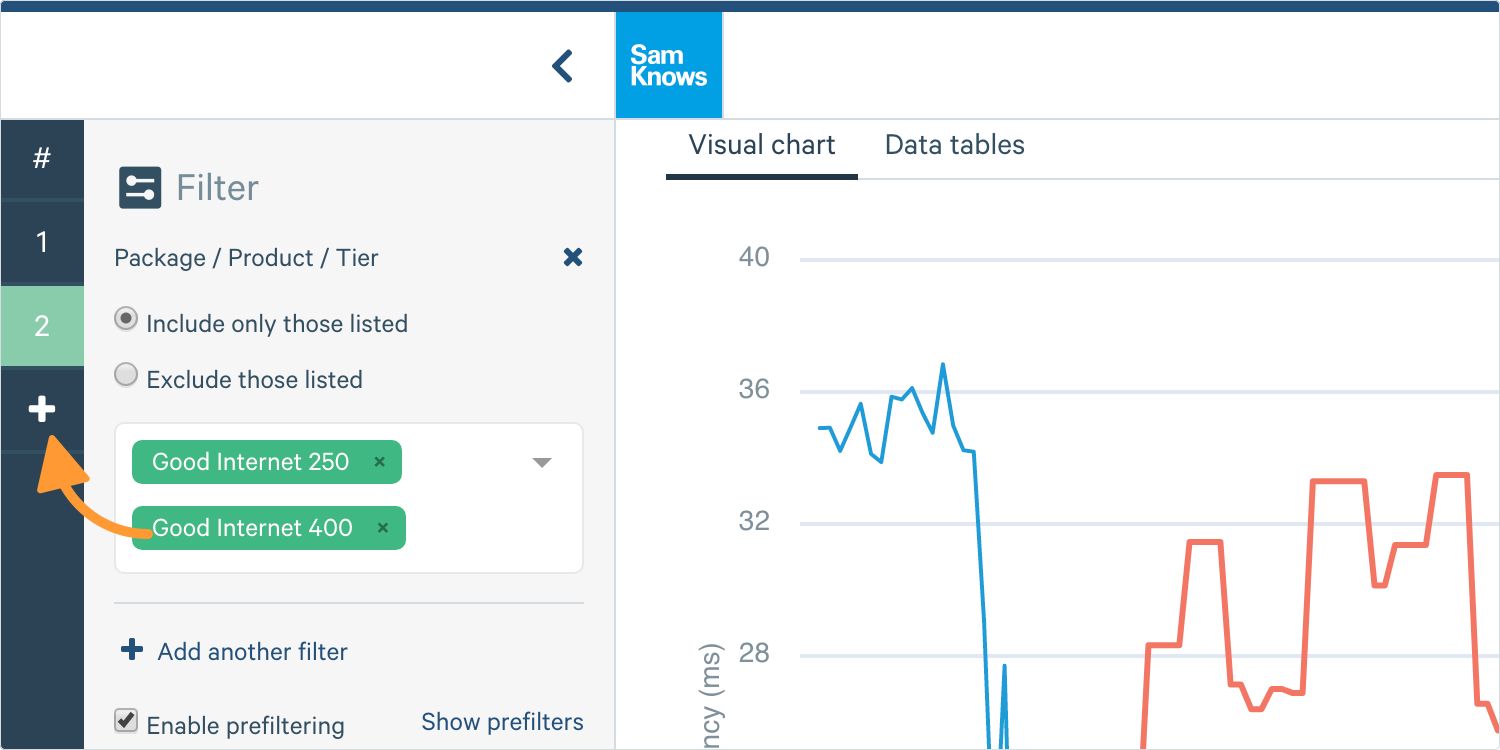
5. If you want to add further data series, just click the + on the left-hand side under the number 2.
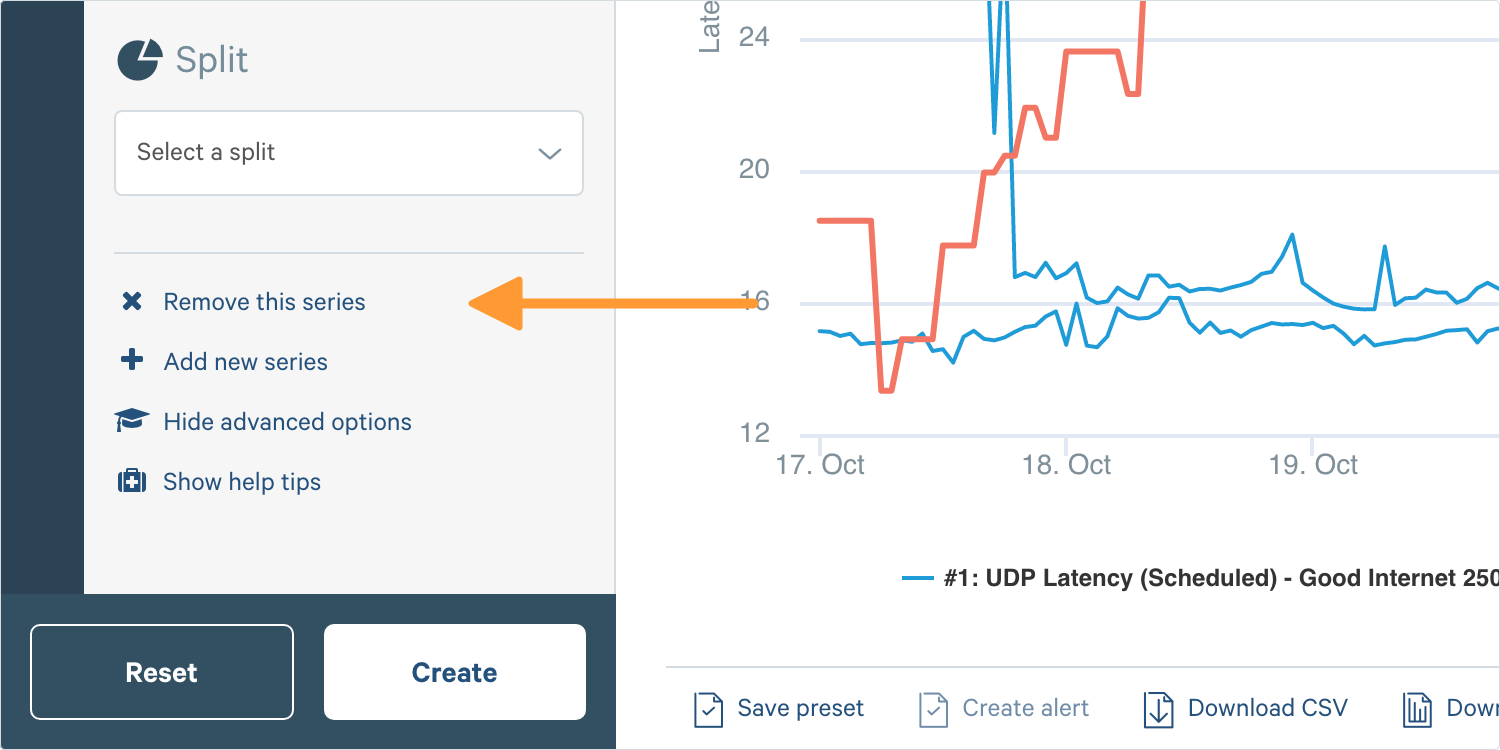
6. To remove a data series, scroll to the bottom of the chart builder and click Remote This Series on the data series you wish to delete.
Tip: To add a preset as a second data series, go to the main presets page and click and drag it over to the chart builder to add it automatically.

