Using Alerts
Governments; ISPs
This guide will walk you through how to use alerting, so you can setup checks for the metrics you care about and be notified when things change or slip below thresholds. This allows you to have peace of mind that SamKnows is monitoring your network for you without a constant need to be refreshing charts just to know if there’s been any change and when there’s a change, you can make sure you know about it first and resolve the issue before your customers start to notice.
Creating an Alert
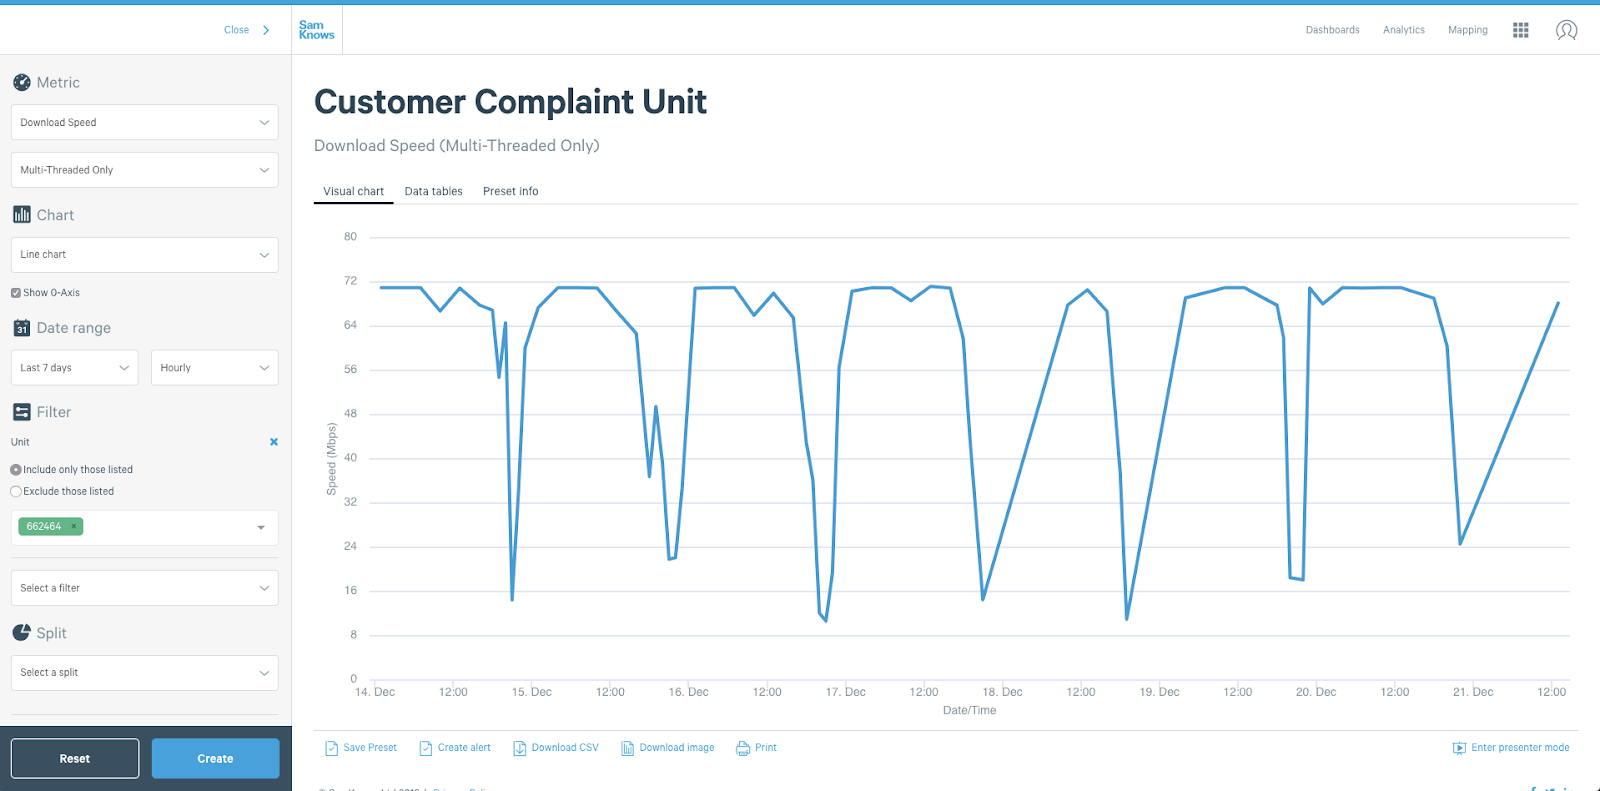
1. Firstly, you should create a line chart in Analytics and save it as a preset. You must also ensure that the data is not split.
Tip: The single line on the chart is the basis for what you’ll be monitoring.
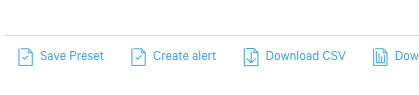
2. Click Create Alert.
3. Set the name of the alert, for example Customer 1235 Complaint by typing where it says Enter Name.

4. Next you define the rule that will trigger the alert.
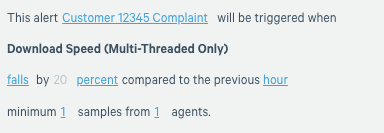
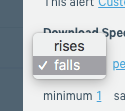
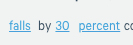
Firstly, set whether or not you want to trigger for it going above or below a Threshold.
Next pick the Threshold, this may be you want to monitor if it goes above or below a set value (e.g. above 50Mbps) or it changes by a particular percentage change.
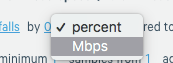
Once you’ve set this, set the value in the field before that dropdown.
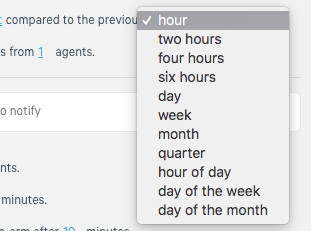
Then, you’ll need to select what you want it to monitor the average for. If you selected a set value (e.g. 20Mbps) then this is just the time period it will average data over to execute the rule on.
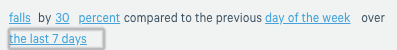
Tip: If you selected a percentage, then this will also determine the period it’s compared to. If you select hour for example, it will compare the current hour to the previous hour. If you select six hours, it will compare the most recent six hours to the previous six hours. The hour of day, day of week and day of month work will only show up if you’ve selected to detect on a percentage difference and they allow you to account for things such as expected peak time speed drops as the hour of day filter for example will allow you to take an average of the past x days at that specific time, and then compare against that value. If you select ‘hour of day’ or ‘day of the month’ or ‘day of the week’ then you’ll get a further option to choose the time period use to generate that trend.
Tip: You can select the minimum number of samples and agents that must be in the data point to trigger an incident, this is useful as it allows you to make sure you don’t get false alerts just because only a couple of agents (which are perhaps under or over performing) have reported.
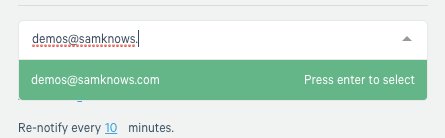
5. Now you’ve built your rule, you can configure some preferences on how it will notify you. You can get email notifications to any organisation user who has access to alerting in your organisation.
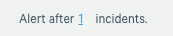
6. You can choose to only email if the check is triggered multiple times with this option.
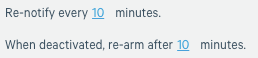
7. You can also select to be re-notified of an ongoing incident and specify an amount of time between an incident ending and it creating a new incident (to prevent flapping).
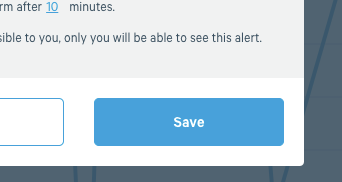
8. If the preset is organisation-visible, you can also select the alert to be organisation visible.
9. Finally, just click Save and you’ll have created your first alert.
Viewing Alerting
To view your checks or incidents, select ‘Alerting’ from the top navigation.
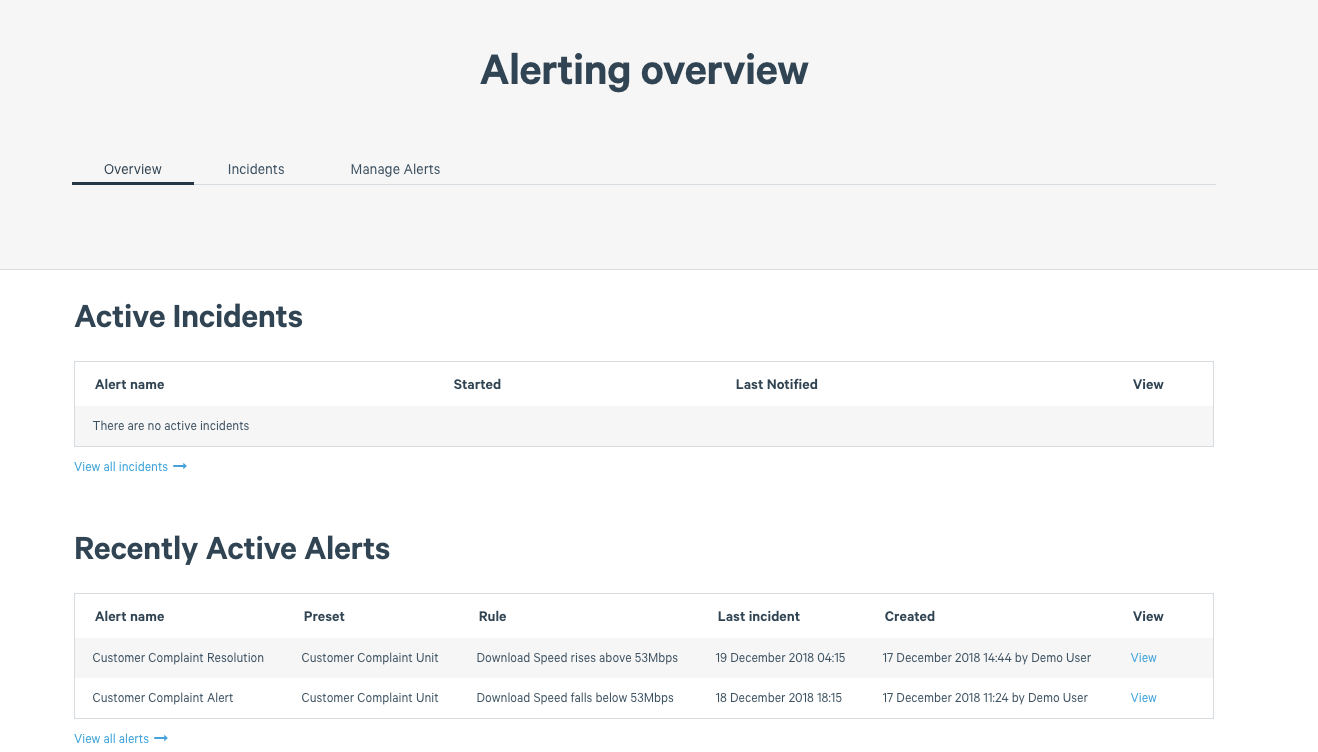
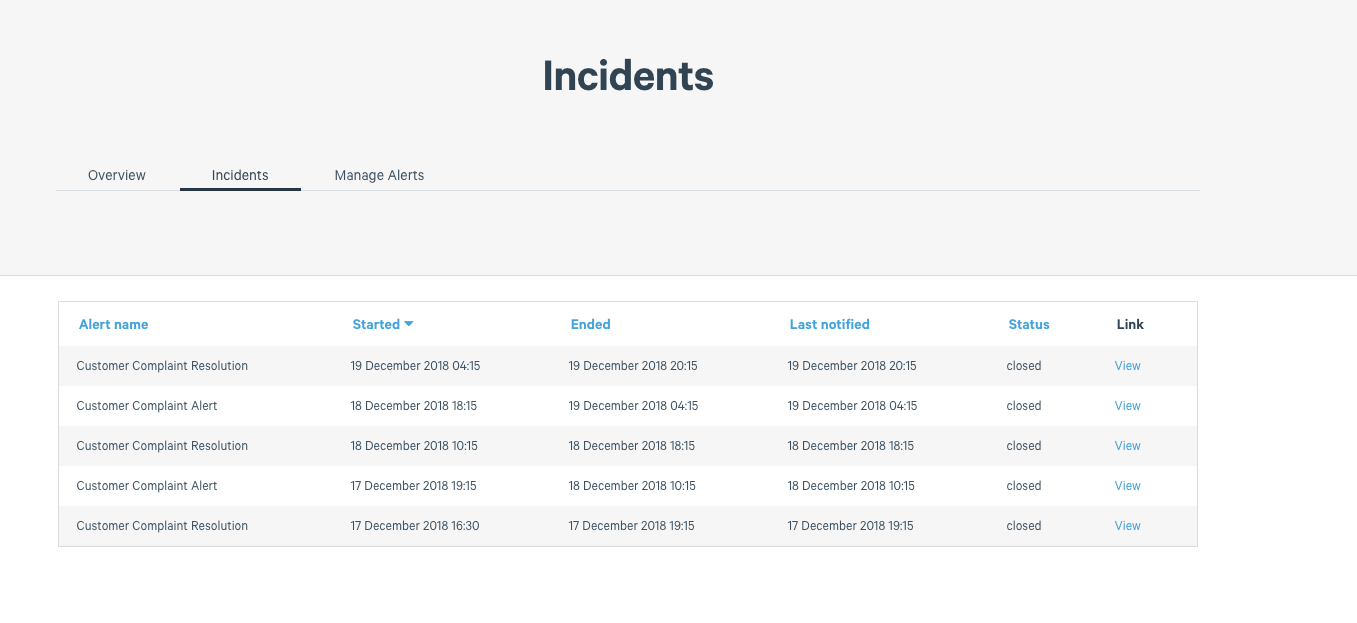
Viewing Incidents
Under incidents you’ll see when alerts have been triggered.
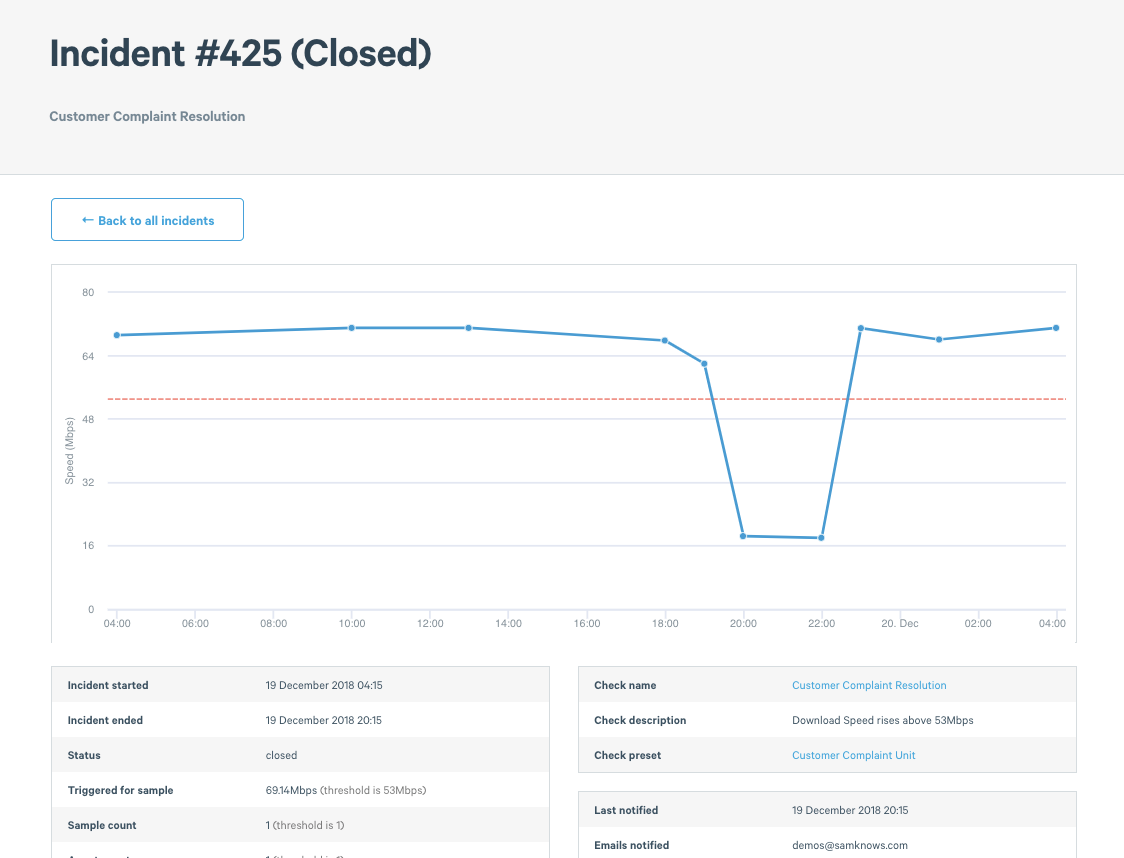
If you view an incident it will render a graph showing you how it occurred and also provide details about the time period of the incident.
Managing Alerts
You can manage and modify your alerts under the Manage Alerts tab
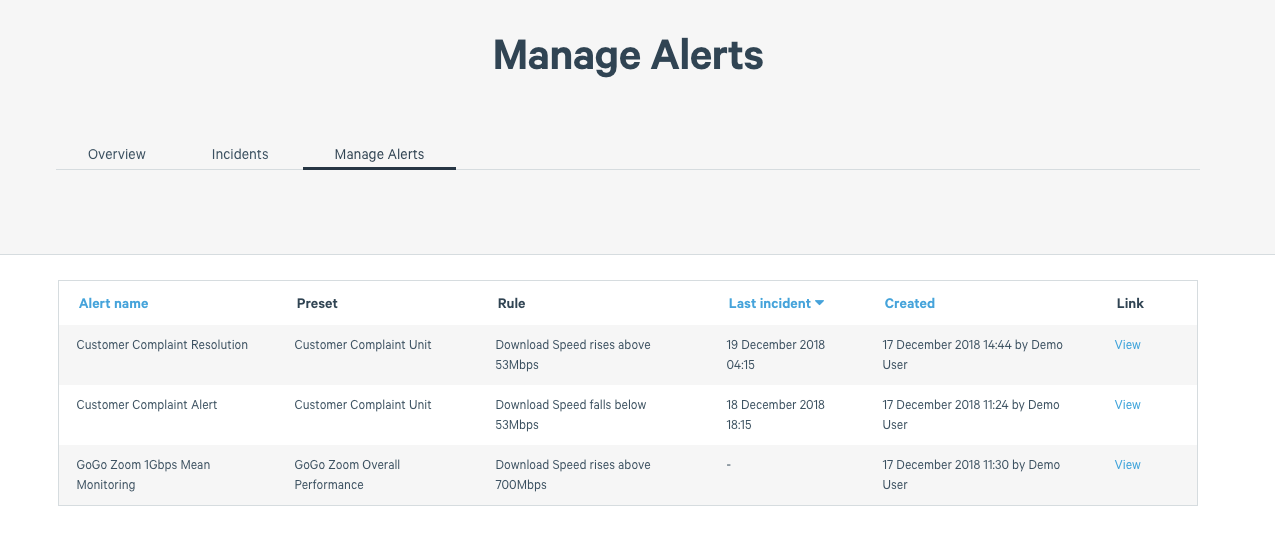

Tip: This includes the ability to view recent incidents on an alert, edit the rules (using the same form as when you create an alert), or deactivate it entirely.

