Exporting Metric & Test Data
Governments; ISPs
This guide will walk you through exporting metric or test data, for use with external analytics tools.
Data Exports Available
1. When you log in to ConnectedHome, select Data Exports from the top navigation. On this page you'll see the Export Builder on the left.
You can export;
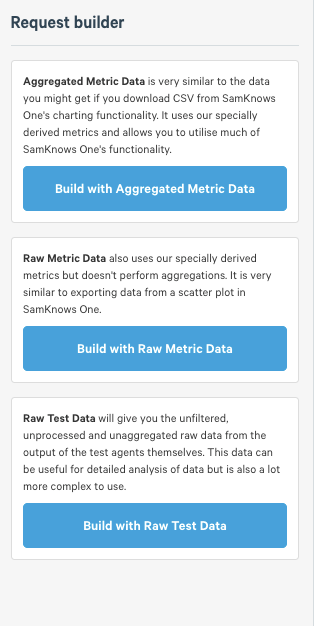
- Aggregated Metric Data is the same kind of data export you’d get if you exported a line chart in ConnectedHome in that it will include things such as the average speed for that bucket (e.g. that hour).
- Raw Metric Data is still pre-processed using prefiltering rules and other filters/splits and allows you to use our derived metrics.
- Raw Test Data is the underlying exact same data that the test clients on agents report back to us and we use to build other metrics.
Aggregate Metric Data
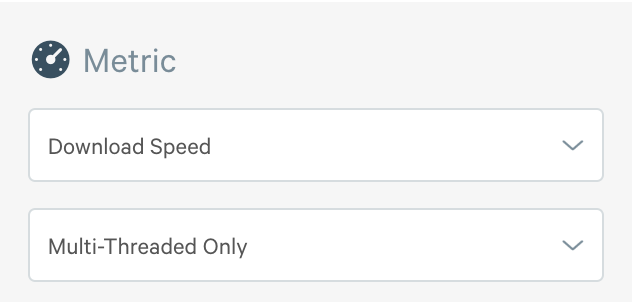
1. Select your Metric from the dropdown. You’ll see all of your subscribed metrics for all of the tests that are assigned to test schedules on your platform. Lets just leave Download selected for now.
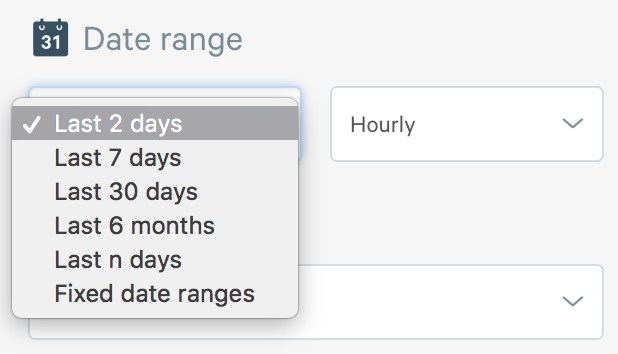
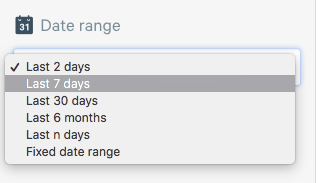
2. Next we select a Date Range, I can choose one of the pre-defined options or customise the date range. For now we’ll just stick with a predefined one and look at the Last 2 Days.
3. Now I select my Aggregation, this will be used for working out how much data to be aggregated into each point on my chart (Time is on the x-axis).
Tip: For example ‘Hourly’ would mean there would be 48 points on my chart’s line, an average speed for each hour in my time range, whereas with ‘Daily’ there would be 2 points, one for the average of each day.
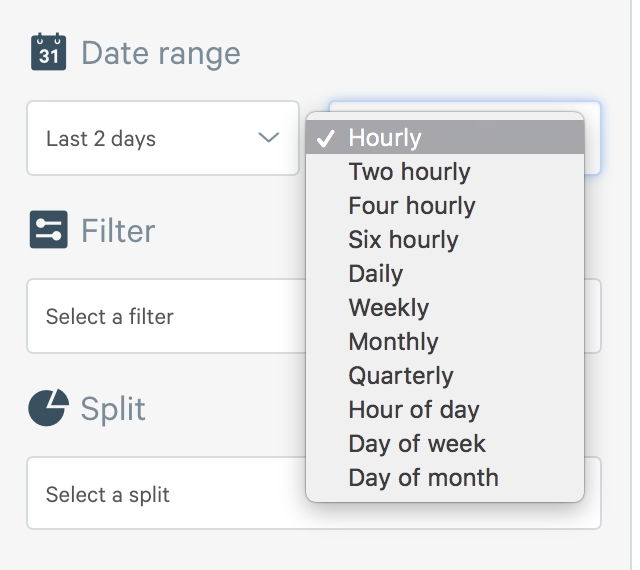
Tip: While most of these aggregations (Hourly, Daily, Weekly) will display time in order on the x-axis, others such as ‘Hour of Day’ will show you the hour (e.g. 4pm) on the x-axis and take all results between 4-5pm in the date range specified. This allows you to analyse things such as ‘the average week’ or ‘the average day’.
4. Next I can select my Filters to restrict the data shown on my chart.
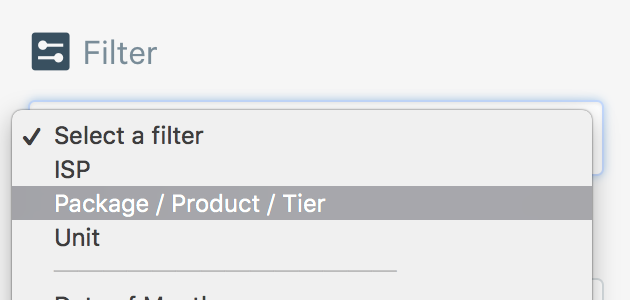
For example, I might restrict it to only show two packages, Konex 80 and Konex 40.
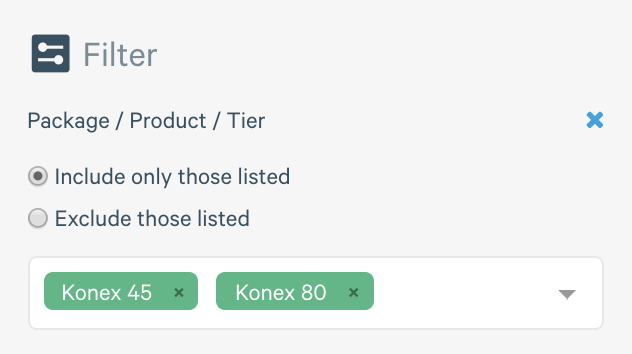
Tip: I can use filters to either only include specific things, or exclude them. For example, I could say ‘show me all the packages except for Konex 45’ or I could say ‘just show me Konex 45’. This might be useful for example to exclude a faulty test server for example.
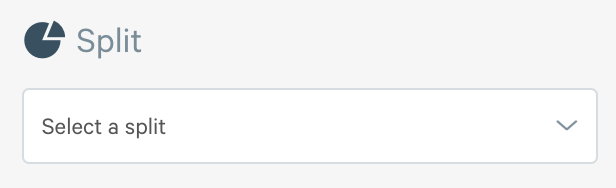
5. Finally, you can Split your Data. This means that data will be grouped into different lines on our chart so we can compare the two.
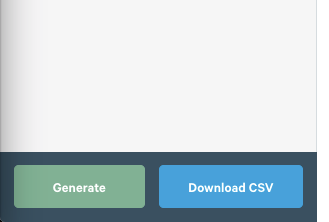
6. Finally, click Download CSV in order to download a CSV in your browser, or, use Generate in order for ConnectedHome to general a CURL example of how to get that data from our Data API that can be run in a terminal or used in internal automated processed and scripts within your organisation.
Raw Metric Data
1. Select your Metric from the dropdown. You’ll see all of your subscribed metrics for all of the tests that are assigned to test schedules on your platform. Lets just leave Download selected for now.
2. Next we select a Date Range, I can choose one of the pre-defined options or customise the date range. For now we’ll just stick with a predefined one and look at the last 2 days.
3. Next I can select my Filters to restrict the data shown on my chart.
For example, I might restrict it to only show two packages, Konex 80 and Konex 40.
Tip: I can use filters to either only include specific things, or exclude them. For example, I could say ‘show me all the packages except for Konex 45’ or I could say ‘just show me Konex 45’. This might be useful for example to exclude a faulty test server for example.
4. Finally, click Download CSV in order to download a CSV in your browser, or, use Generate in order for ConnectedHome to general a CURL example of how to get that data from our Data API that can be run in a terminal or used in internal automated processed and scripts within your organisation.
Raw Test Data
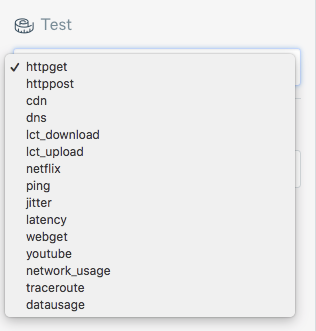
1. Select your Test from the dropdown. You’ll see all of the tests that are currently used in agents test schedules, or for mobile/web panels all your subscribed tests.
2. Next we select a Date Range, I can choose one of the pre-defined options or customise the date range. For now we’ll just stick with a predefined one and look at the last 2 days.
3. Finally, click Download CSV in order to download a CSV in your browser, or, use Generate in order for ConnectedHome to general a CURL example of how to get that data from our Data API that can be run in a terminal or used in internal automated processed and scripts within your organisation.

